
Finance
Automated Dashboard for Ticketing Data
This case study highlights the transformation of a service company’s reporting process through a Microsoft Power BI dashboard that automated and centralized data from multiple sources.
This case study highlights the transformation of a service company’s reporting process through a Microsoft Power BI dashboard that automated and centralized data from multiple sources.
The rich text element allows you to create and format headings, paragraphs, blockquotes, images, and video all in one place instead of having to add and format them individually. Just double-click and easily create content.
A rich text element can be used with static or dynamic content. For static content, just drop it into any page and begin editing. For dynamic content, add a rich text field to any collection and then connect a rich text element to that field in the settings panel. Voila!
Headings, paragraphs, blockquotes, figures, images, and figure captions can all be styled after a class is added to the rich text element using the "When inside of" nested selector system.
Our customer, a medium-sized IT services company, manually managed their financial and ticketing figures by collecting data from Weclapp related. This process was very time-consuming and required two to three days each month to access, compile, and analyze the reports. Our customer needed to manually review reports and collect data on key figures such as revenue, hours recorded, number of tickets, and other matters.
This manual approach was inefficient, often delayed decision-making and affected the ability to respond quickly to trends in workload or financial performance. To address this, the customer needed a more efficient system to centralize data and provide actionable insights in an easy-to-use form.
We hit Microsoft Power BIdashboard and developed it to centralize and automate the customer's reporting process. The dashboard was designed to include data from various sources, including APIs, excelfiles and Postgres-Databases, seamlessly integrated. Since the data was automatically updated every night, users always had access to the latest information without having to manually retrieve it.
To meet our client's diverse reporting needs, the dashboard included customizable visualizations that allowed users to filter and explore specific metrics, such as ticket status and monthly performance.

When designing the dashboard, emphasis was placed on simplicity and clarity so that it was easy to navigate without overwhelming users. Several design options were also suggested to ensure that the customer's aesthetic preferences and usability requirements were taken into account. By balancing modern aesthetics and functionality, we were able to design a dashboard that was both visually appealing and highly intuitive.
Finally, the dashboard was also developed with modular components, so that as their business grew, our customer was also able to expand reporting capabilities.
The implementation of the Power BI-Dashboards changed our client's reporting in several ways. For one thing, the automated dashboard eliminated the need for manual data collection, reducing reporting time that previously took several days. Thanks to the nightly data update, users can access real-time metrics every morning, which enables faster decision making and a faster response to business needs.
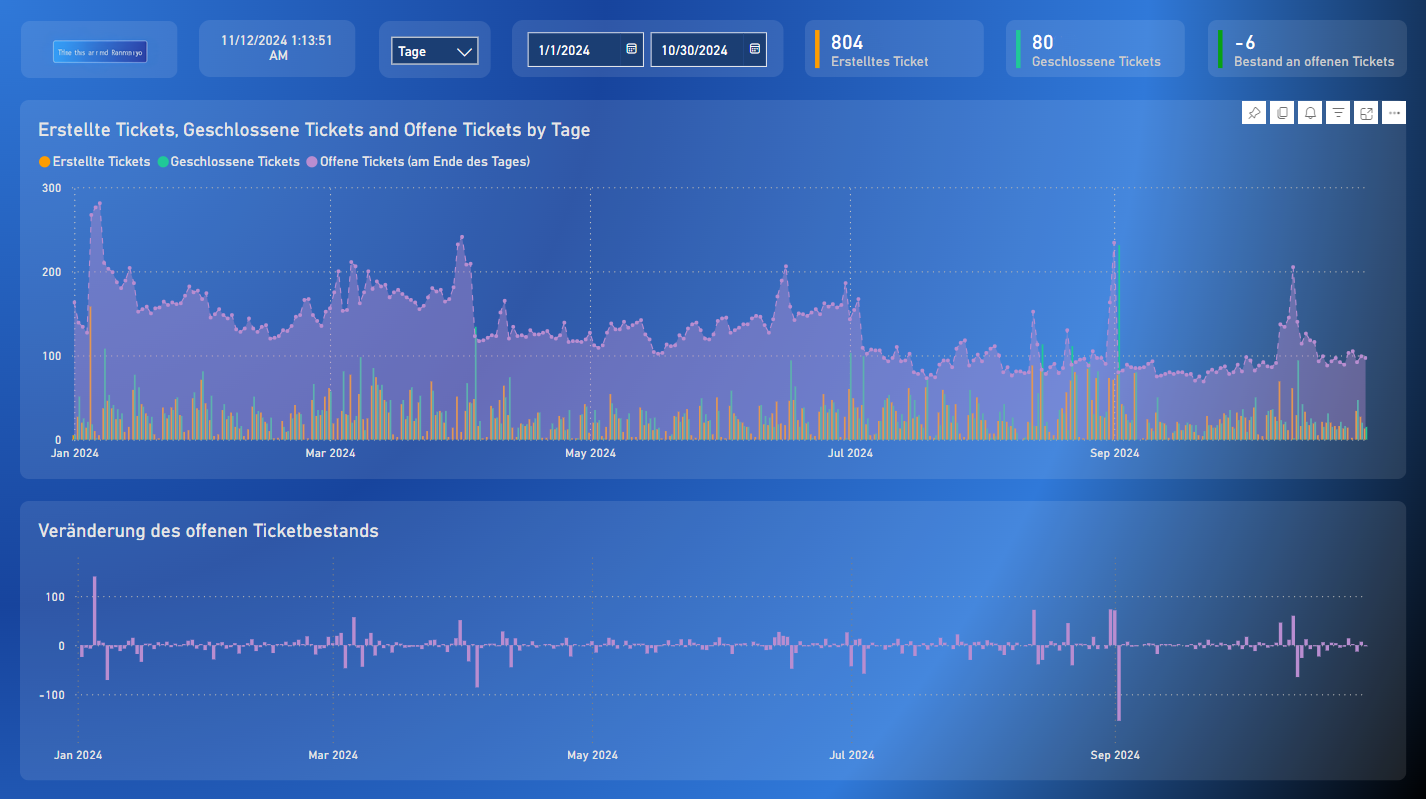
The dashboard's color-coded representations also provide instant clarity about performance metrics and make it easy for our customer to identify ticket trends and other trends, such as workload fluctuations, workload distribution, and revenue growth. The dashboard also offers the option to drill down into specific segments of data for detailed insights.
The modular structure also makes it a user-friendly solution that can be adapted to future data sources, metrics, and reporting requirements. As our client's needs evolve, the dashboard can be expanded without the need for a complete overhaul, making it a sustainable, long-term solution.
This case study shows how we were able to recreate existing reports with fully automated updates and add new modules to help a company deepen data. In this way, the company was also able to easily create clearer and more insightful visualizations.
With our AI and automation solutions, we make your organization faster, more flexible and more powerful — and create measurable results along the entire supply chain.
Arrange a consultation now


